
Data does not speak for itself, people tend to think in images rather than in numbers or words. Therefore, it is an enormous enrichment to make use of an interactive map, in which big amounts of data can be summarised into one figure. This does not only help to give insight in the possibilities, but also tells a story, shows trends, and highlights patterns. In this blog it becomes clear what an interactive map is, and when it can best be deployed.
The power of interactive maps
The world around us is constantly changing. From the location of stores, where customers live and companies are starting up to climate change, traffic and where new houses are being built. By combining complex data and visualizing them into an interactive map, possibilities become clear and easy to understand, as you can then see where your product or service has the potential to conquer the market, where houses are being built, where traffic flows can be improved and so on. By taking all of this into account, (commercial) opportunities can be exploited. An interactive map is therefore of great value for persons, companies and the society as whole.
Sustainable Roofs Opportunity Map
An example of an interactive map is the Sustainable Roofs Opportunities Map. We have developed this map for municipalities, so that they can easily see which roofs are suitable for a green roof (sustainable roof).
")
The Sustainable Roofs Opportunity Map has been established by combining different datasets and plotting them on a map. House characteristics like height, type of roof and year of construction are combined with the environmental factors water level (after rainfall) degree of heat and sunlight. By integrating and modeling this data, added value is reached. For every roof there is a perfect solution. For example: a modern flat roof in a water stress area is perfectly fit for a green roof with water storing qualities and an old pitched roof with a lot of sunlight is fit for solar panels. When using the Sustainable Roofs Opportunity Map, municipalities can easily see which sustainable roof is the most profitable and beneficial. Government climate targets can be achieved as a result.
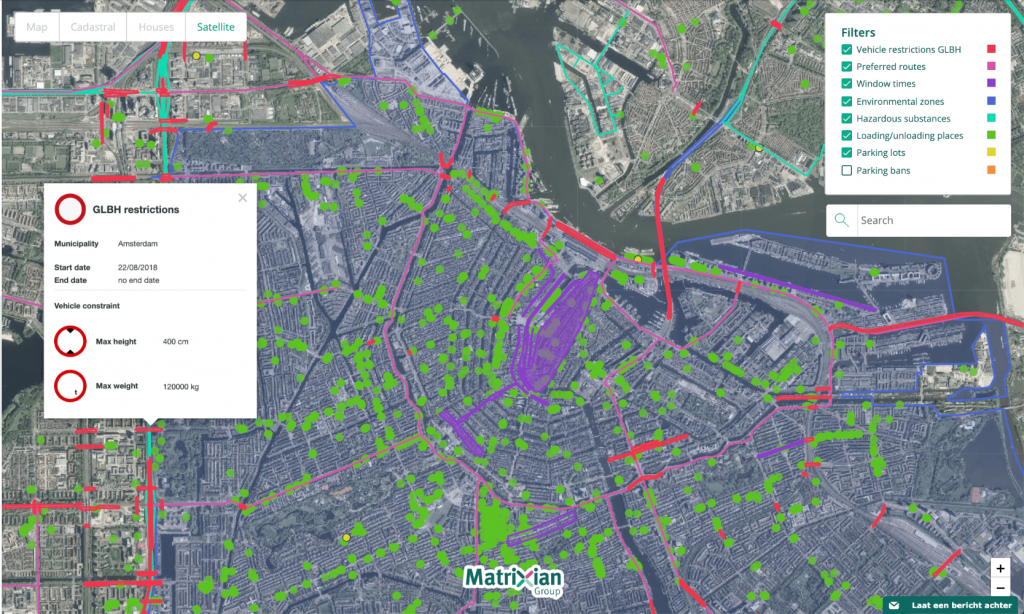
Matrixian Map
In the world of Big Data, interactive maps are essential. They are necessary for making complex analysis understandable, seeing new opportunities and making data driven decisions. Via Matrixian Map, we deliver custom made interactive maps which meet specific needs of customers. With our vast amount of consumer, real estate, mobility and logistic data we can design extensive maps. Whether it concerns a map that shows your (potential) customers, indicates on which roofs solar panels can be placed or when certain shopping areas can be supplied, with our knowledge of persons, households, companies and objects, almost anything is possible.
Interested?
Are you interested in the possibilities? Please do not hesitate to contact us via the following phone number: +31 (0)20 244 0145.
Related products

Matrixian Map

Charging Station Opportunity Map

Mobility Map
